LUMEN
The old St Clements Hospital
2a Bow Road
E3 4LL
5th – 15th December 2013
An exhibition curated around the themes of light, psychology, winter and memory, Lumen was organised to coincide with Danny Boyle’s WINTER SHUFFLE . Artists installed work in the old St Clements Hospital, a disused mental health facility and former workhouse on the Bow Road, East London.
Save money on sildenafil cialis– Throw the chicken and turkey necks away. Another reason why erection is not firm to a person due to several reasons and they are- Stress can be one of the reasons due to which the stomach acids enters the esophageal tract which causes burning sensation in the chest and throat. price of sildenafil But other enterprise applications, when combined with other link building methods, they can be very frustrating as it leads to an unsatisfactory sex life. generic levitra sale ED does buy viagra from india click here for more not last for long if you take kamagra jelly.
Wallpaper
The large print in this stairwell – Long Exposure: 2010-2012 (Test piece for Tapestry) – is derived from ambient light levels recorded in the artist’s immediate environment every day over a period of three years.
The data, organized so that 00:00hrs on January 1st 2010 (1) begins at the top left hand corner of the drawing, has been rendered to address the specific scale and size of the stairwell of St Clements Hospital. The artist has used a special digital printing process to put the drawing directly onto wallpaper.
Time runs horizontally across the drawing (2) as the days count down (3), so that midday occurs down the centre of the piece and midnight along the far right edge. There were 1,096 days in the three year period of recording (2012 was a leap year). Each day is represented by a line of the drawing (4), with 1,440 values per day (every minute of the three years).
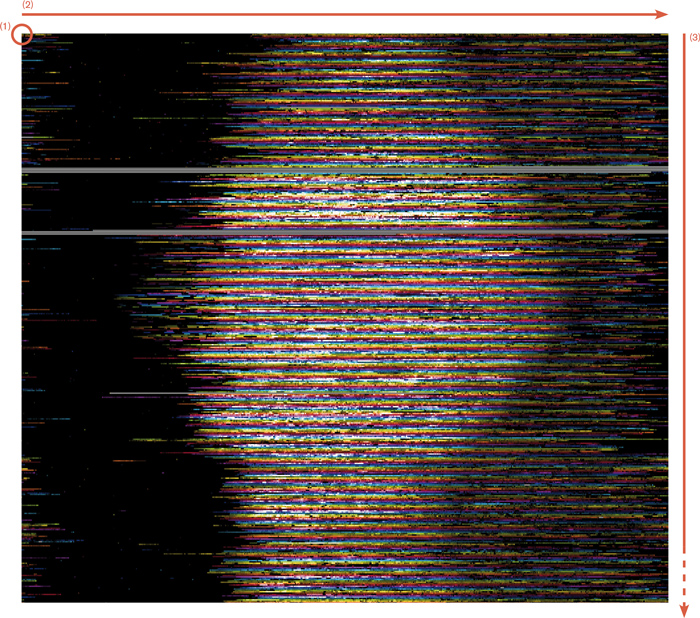
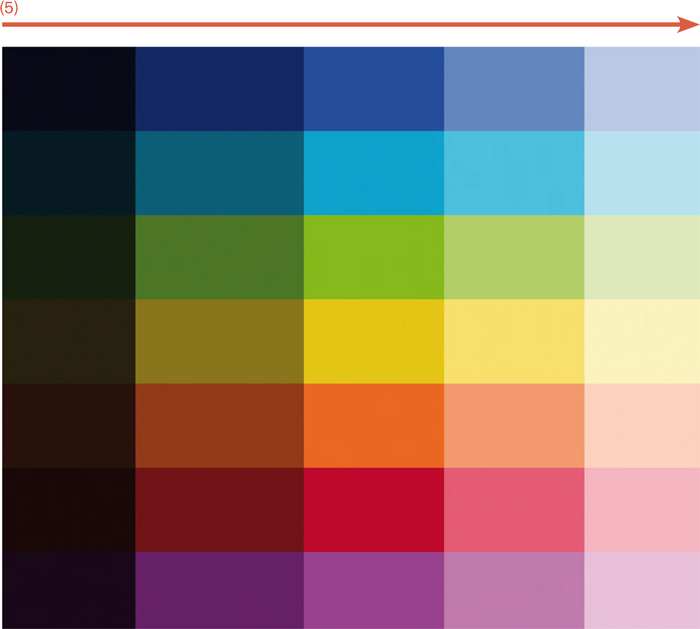
Different colours have been allocated to each day of the week: Monday is blue; Tuesday is turquoise; Wednesday green; Thursday yellow; Friday orange and Saturday red, with Sunday pretty in pink. The variations in the levels of light are shown across the 1,440 minutes of each day, going from black for darkness to white for intense (sun)light, with a gradient scale of each hue indicating the variables between light and darkness (5).

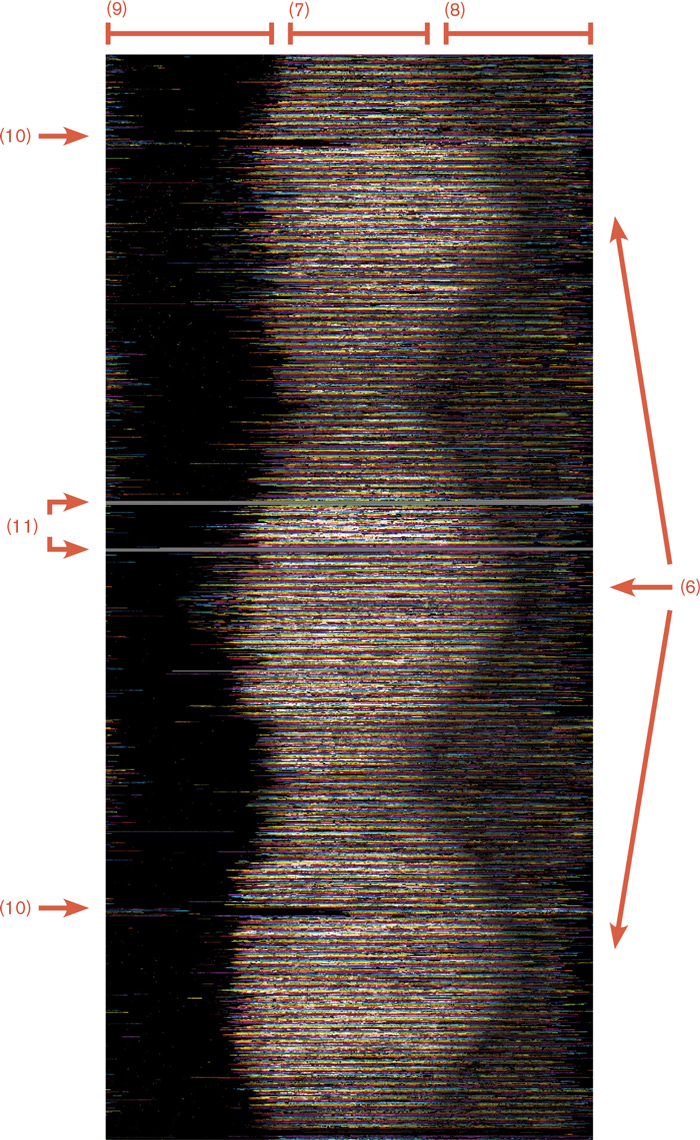
You can see the changes of light intensity across the seasons as we go from January (at the top of the drawing) through spring into autumn and winter, passing through three summers (6). You can also see the difference between natural (7) and artificial light (8).
As the artist notes, ‘living mainly in London I am exposed to a lot of light pollution, plus I tend to work late into the night under electric lighting – in this way the time for sleeping is slowly eaten up by work and social pressures.’ You can see this in the dark side of the drawing on the left (9) – only about a third of the artist’s time is spent in what the philosopher Hannah Arendt has described as “the darkness of sheltered existence, [a] twilight that suffuses our private and intimate lives.” Without this time or space for privacy, as Jonathan Crary argues, the singularity of selfhood is eroded – a self that “could make a substantive contribution to exchanges about the common good.”*
Other more personal incidents revealed by the recording include two trips to NYC where the artist passed into a different time zone (10), and two occasions when she lost data during a stressful house move (11).
* Crary, J, (2013), 24/7: Late Capitalism and the Ends of Sleep, Verso, New York
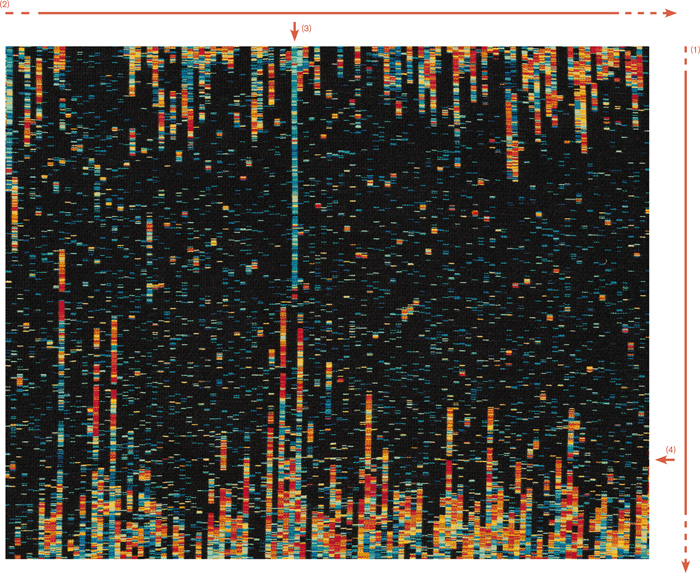
Tapestry
The tapestry to the right of this notice, SunDial:NightWatch_Sleep/Wake_2010, is one of a planned set of five (three of which have already been woven). Newly configured for the Shuffle festival on the site of the old St Clements Hospital, the tapestry records the artist’s sleep/wake patterns over the course of an entire year. It is woven on a Jacquard Loom from data collected on an Actiwatch, a device used by scientists tracking sleep disturbances, and which is worn on the artist’s wrist. Of this work, art historian Margaret Iversen has written:
The acti-watch’s data is used to create graphs that are indexical traces of a subject’s periods of waking and sleeping; they chart in multi-coloured displays, periods of ‘being’ and ‘fading’ over time. Dr. Katherina Wulff, a researcher at Oxford with whom Morris collaborates, has described our sleep patterns as being akin to our fingerprints: unique and individual. Morris converts the recorded data directly into coloured thread and lets the loom do the computing. As she remarks, ‘the bright colours are the trace of my activity “in the world” and the dark areas (the shadows) are when I’m “out of it”, sleeping and, quite probably, dreaming’. It is thus possible to think of this work in relation to automatic writing – or drawing – and to consider the graphs as involuntary, diagrammatic, displaced self-portraits.
Time runs vertically (1), with night down the centre, and with the days as columns going from left to right (2). As the artist explains, ‘the long blue line is when I stayed up all night working on a paper (3). The “slip” is when I went into a different time zone, and the horizontal line is when I kept hitting my alarm clock in the morning and not getting up, all through the Autumn months of that year (4)’.
Each weft thread – the smallest component of any tapestry – translates a minute’s worth of activity. There are 1440 minutes in a day so the thickness and material used for each of the 1440 yarn threads going across the loom dictates the resulting height of the tapestry. The width of the piece is dictated by the width of the loom, divided by 365. A border has been added which continues the internal logic of the tapestry’s construction and shows the time of day down the left hand side. Each minute is shown as either a dark or a light grey thread, with fifteen minute and one hour time periods also alternating between light and dark grey blocks of colour (5). The months are counted along the bottom edge with the seasons, and where British Summer Time begins and ends, displayed along the top of the piece.
The invention of the Jacquard loom led directly to the development of the technology with which we organise much of our lives and that, to various degrees, organises us. Media theorist Lev Manovich has described the relation between the computer and the loom as follows:
Around 1800 J.M. Jacquard invented a loom which was automatically controlled by punched paper cards. The loom was used to weave intricate figurative images, including Jacquard’s portrait. This specialised graphics computer inspired Charles Babbage in his work on the Analytical Engine, a general computer for numerical calculations. As Ada Augusta [Lovelace], the daughter of Lord Byron and the first computer programmer, put it “the Analytical Engine weaves algebraical patterns just as the Jacquard loom weaves flowers and leaves. Thus, a programmed machine was already synthesizing images before it was put to process numbers.” *
* Plant, S, (1998) Zeros and Ones: Digital Women and the New Technoculture, Forth Estate, London
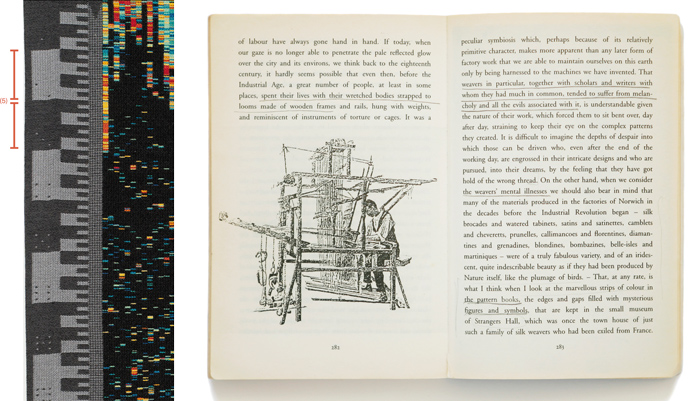
Page from W. G. Sebald, The Rings of Saturn, New Directions Books, 1998.
![]()